Data Sub-Genre Focus
Admissions & Enrollment by Race/Ethnicity (2003–2022). Using raw IPEDS/NCES tables and institution-reported Common Data Set (CDS) figures to understand who gets admitted and enrolled across time.
In-Depth Examples with Screenshots, Captions & Links
Example A — IPEDS Trend Generator (NCES)
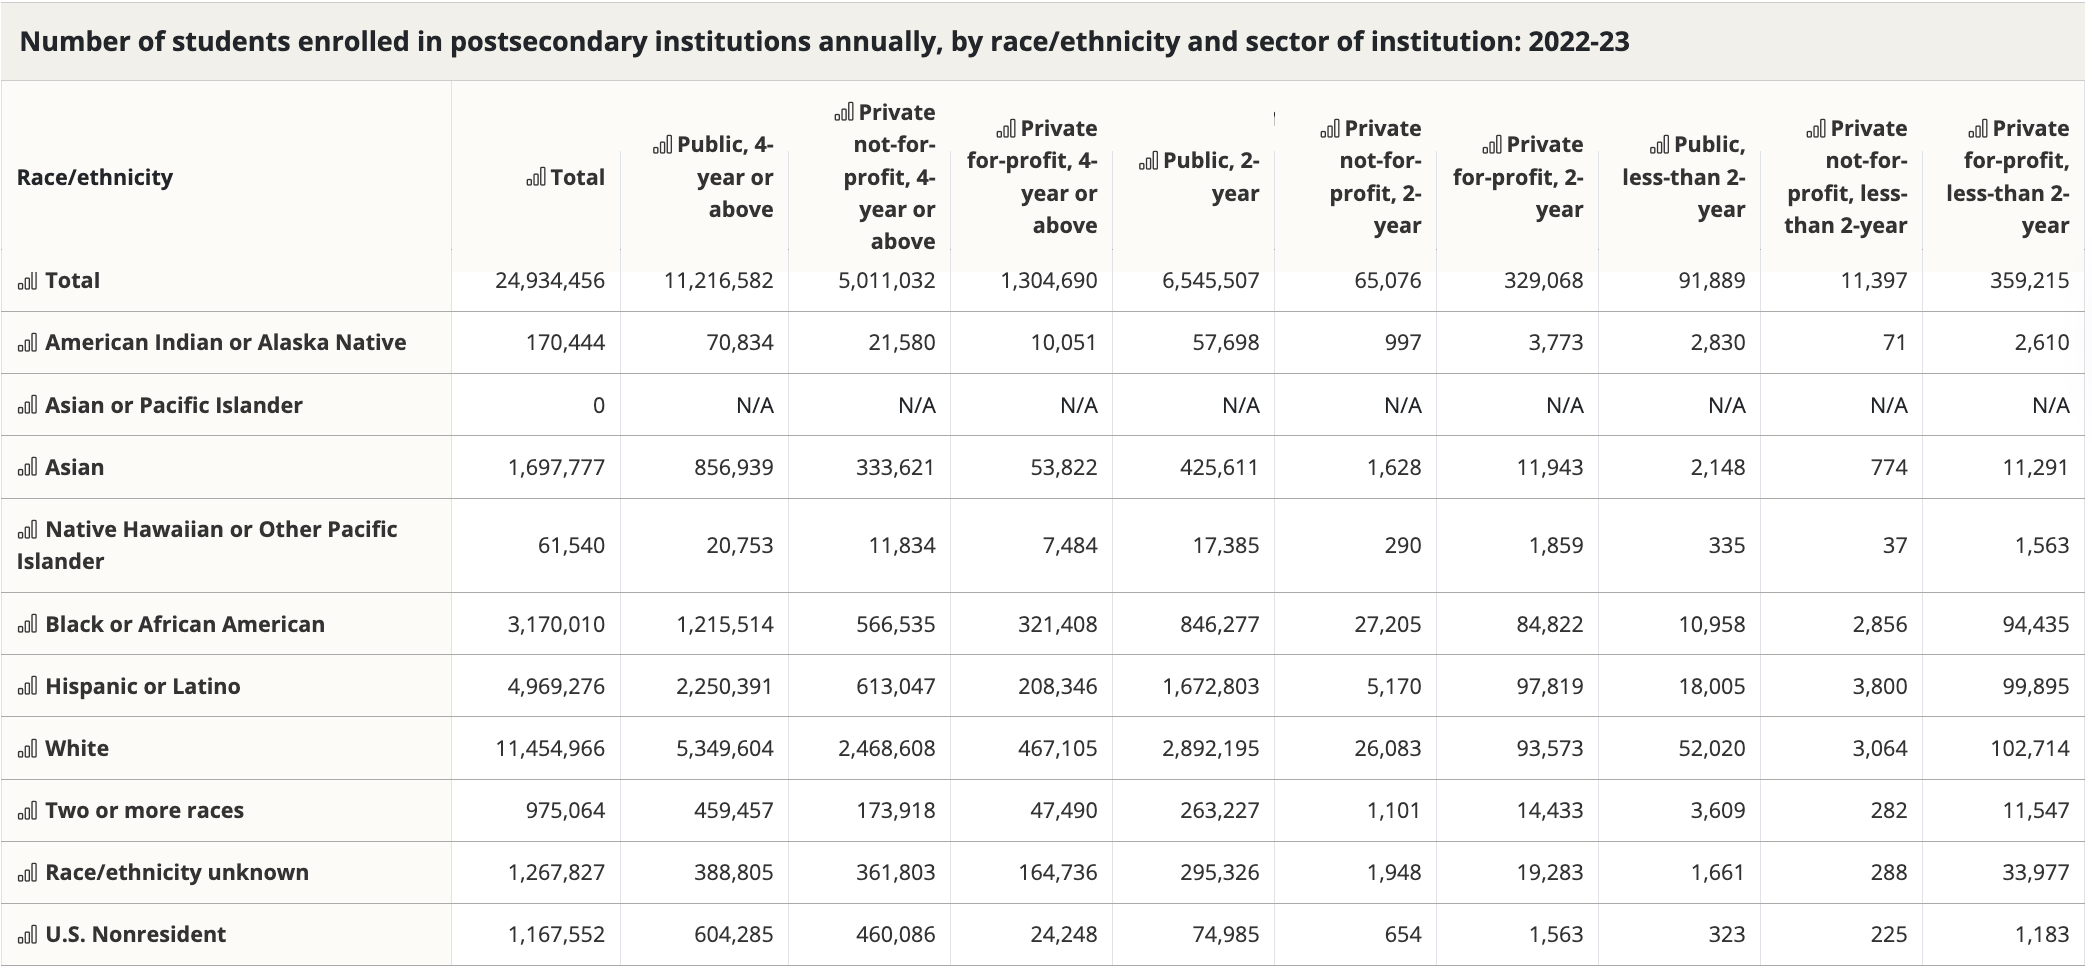
Use IPEDS Trend Generator to pull raw counts by race/ethnicity for each year. From these counts, compute shares (e.g., White ≈ 67% in 2003 → ≈ 55% in 2022; Hispanic ≈ 10% → ≈ 20%).
How to use: Choose “Enrollment by race/ethnicity”, set years 2003–2022, export CSV.
Insight: The U.S. undergraduate population has diversified; Hispanic growth is the largest proportional increase.
Example B — NCES Digest of Education Statistics (Raw Tables)
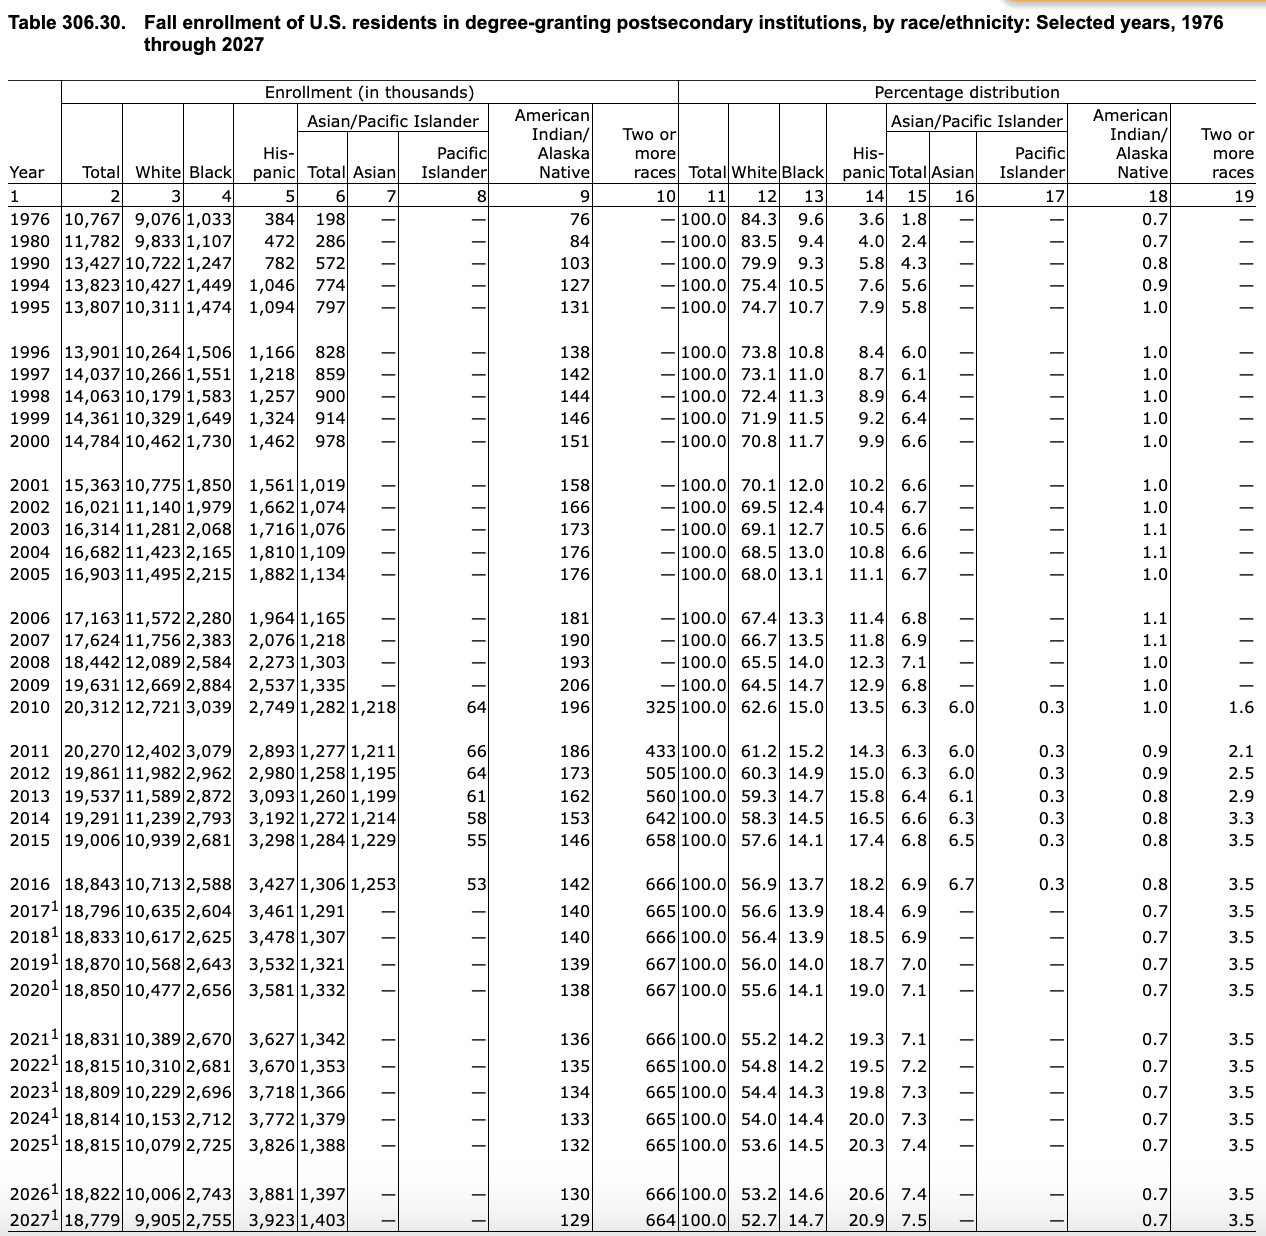
Download the raw tabular data (e.g., Table 306.30) to validate totals and compute year-over-year changes. This table provides counts for White, Black, Hispanic, Asian students that you can turn into percentage share and trend summaries.
How to use: Identify the rows for 2003 and 2022, copy counts, compute shares.
Insight: Confirms long-run structural changes: declining White share, rising Hispanic/Asian shares.
Example C — U.S. Census Bureau (ACS 2021: School Enrollment in the United States)
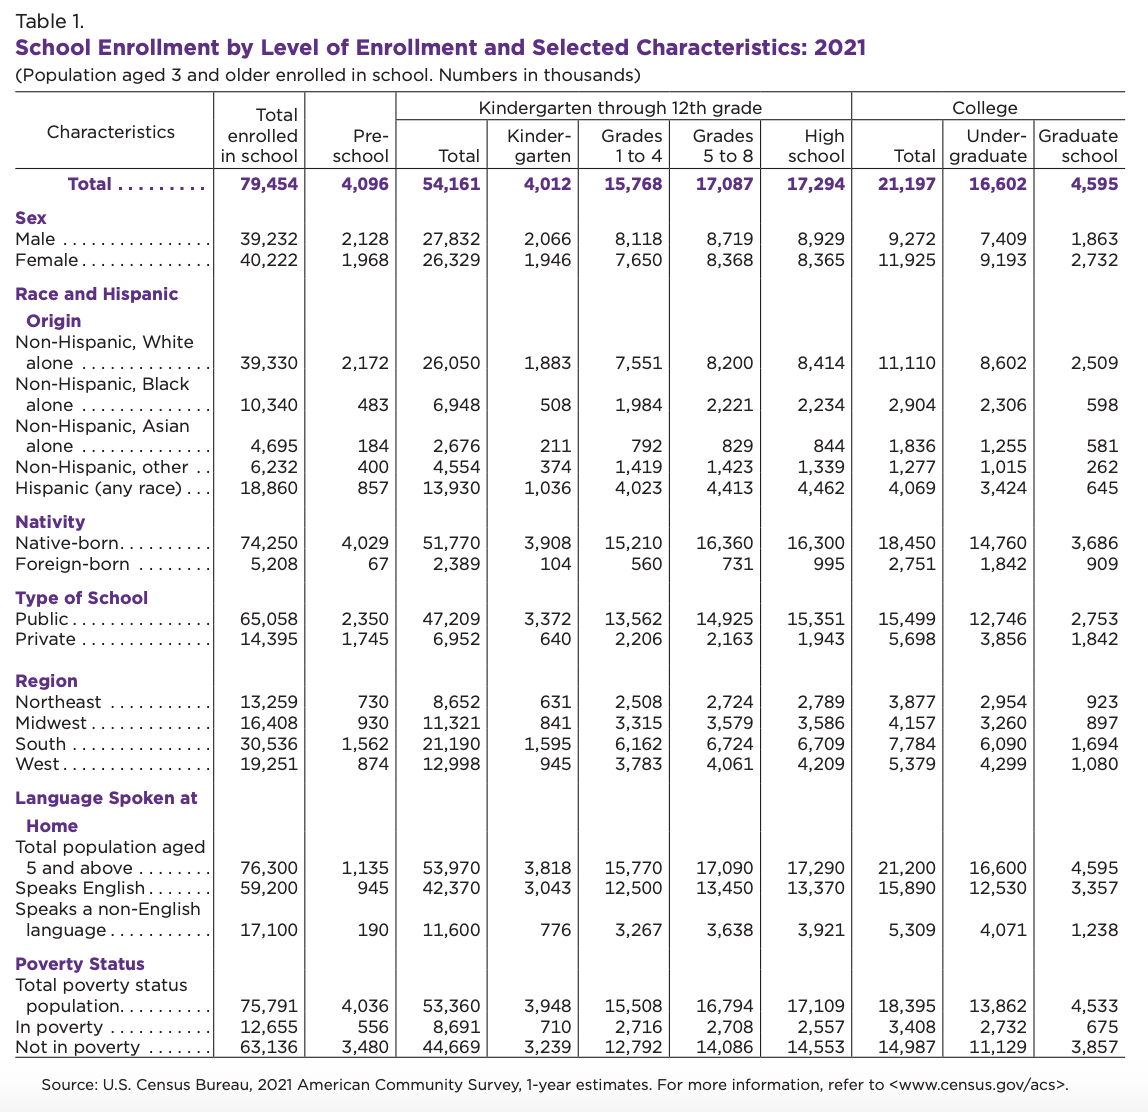
What this shows: The ACS 2021 table reports college enrollment in thousands by level and demographics. In the college columns, the United States had about 16.6 million undergraduates and 4.6 million graduate students in 2021, broken out by race/ethnicity (e.g., Non‑Hispanic White ≈ 8.6M undergraduates; Black ≈ 2.3M; Hispanic ≈ 3.4M; Asian ≈ 1.3M).
How to use: Use ACS counts to compute shares within a single year (e.g., undergraduate composition in 2021) and compare with IPEDS headcounts across years. Because ACS also lists nativity, language at home, and poverty status, you can examine how socioeconomic factors align with enrollment differences by race/ethnicity.
Insight: ACS corroborates the diversification of U.S. higher education: Hispanic and Asian undergraduates represent sizable shares by 2021, while Black undergraduate counts remain lower relative to population size, highlighting persistent equity gaps that complement IPEDS time‑series trends.
Web Resources (Logos • Names • Links • Sample Screens)
Enrollment by Race/Ethnicity (2003–2022)
Table 306.30 — Fall enrollment by race/ethnicity
Official PDF
How to Use These Resources to Draw Insights
Step 1: Get raw counts from IPEDS Trend Generator (2003–2022). Export CSV.
Step 2: Validate counts using NCES Digest Table 306.30 for target years (e.g., 2003, 2022).
Step 3: Compute shares & deltas: percentage of each racial group and change over time.
Step 4: Contextualize with institutional cases (e.g., Reuters/MIT) to show policy sensitivity.
Step 5: Present a short narrative: long-run diversification + short-term policy shocks.
Improved, Raw-Data-Centric Outputs (Step 5)
Interactive raw table: with year/race filters (pulls directly from IPEDS CSV; no pre-aggregated charts).
On-page percentage calculator: user selects year → converts raw counts to shares instantly.
Time-slider explorer: maps raw rows (2003→2022) to a minimal line view; values shown as exact counts on hover.
Policy overlay: toggles to highlight 2023 events on top of the raw series while keeping the numeric table primary.
Download panel: linking to the exact CSVs used (so readers can audit every figure).